 XO REPORT FOR GOOGLE SHEETS
Xero reports in Google Sheets.
Inserted and refreshed from the sidebar.
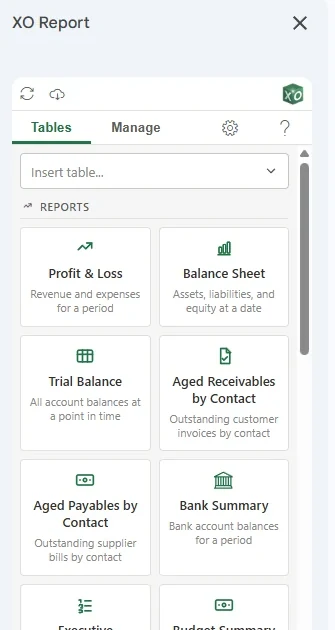
Open the XO Report sidebar, pick a report or a list, choose the companies and the dates, and insert. When Xero changes, refresh one table or all of them.
14-day free trial. Same plans as Excel, one subscription for both.
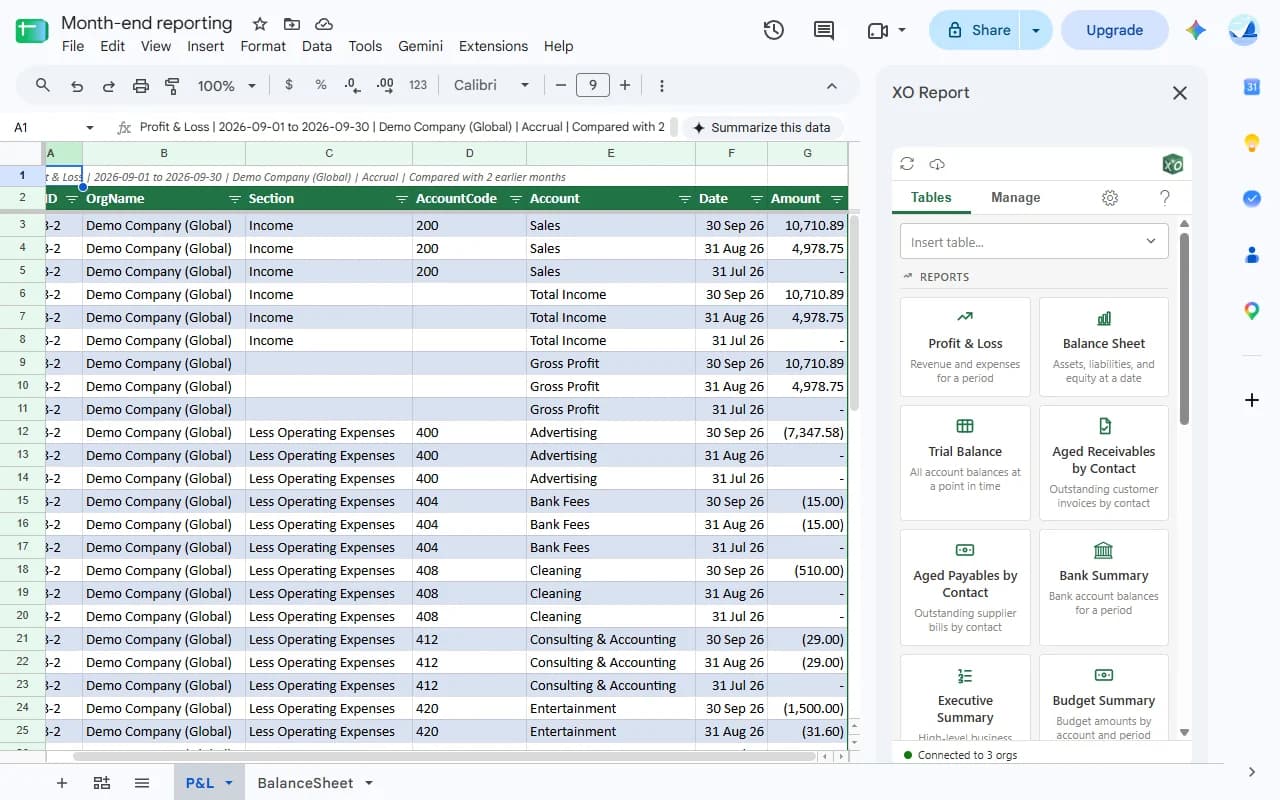
Xero reports in Google Sheets.
Ready to insert.
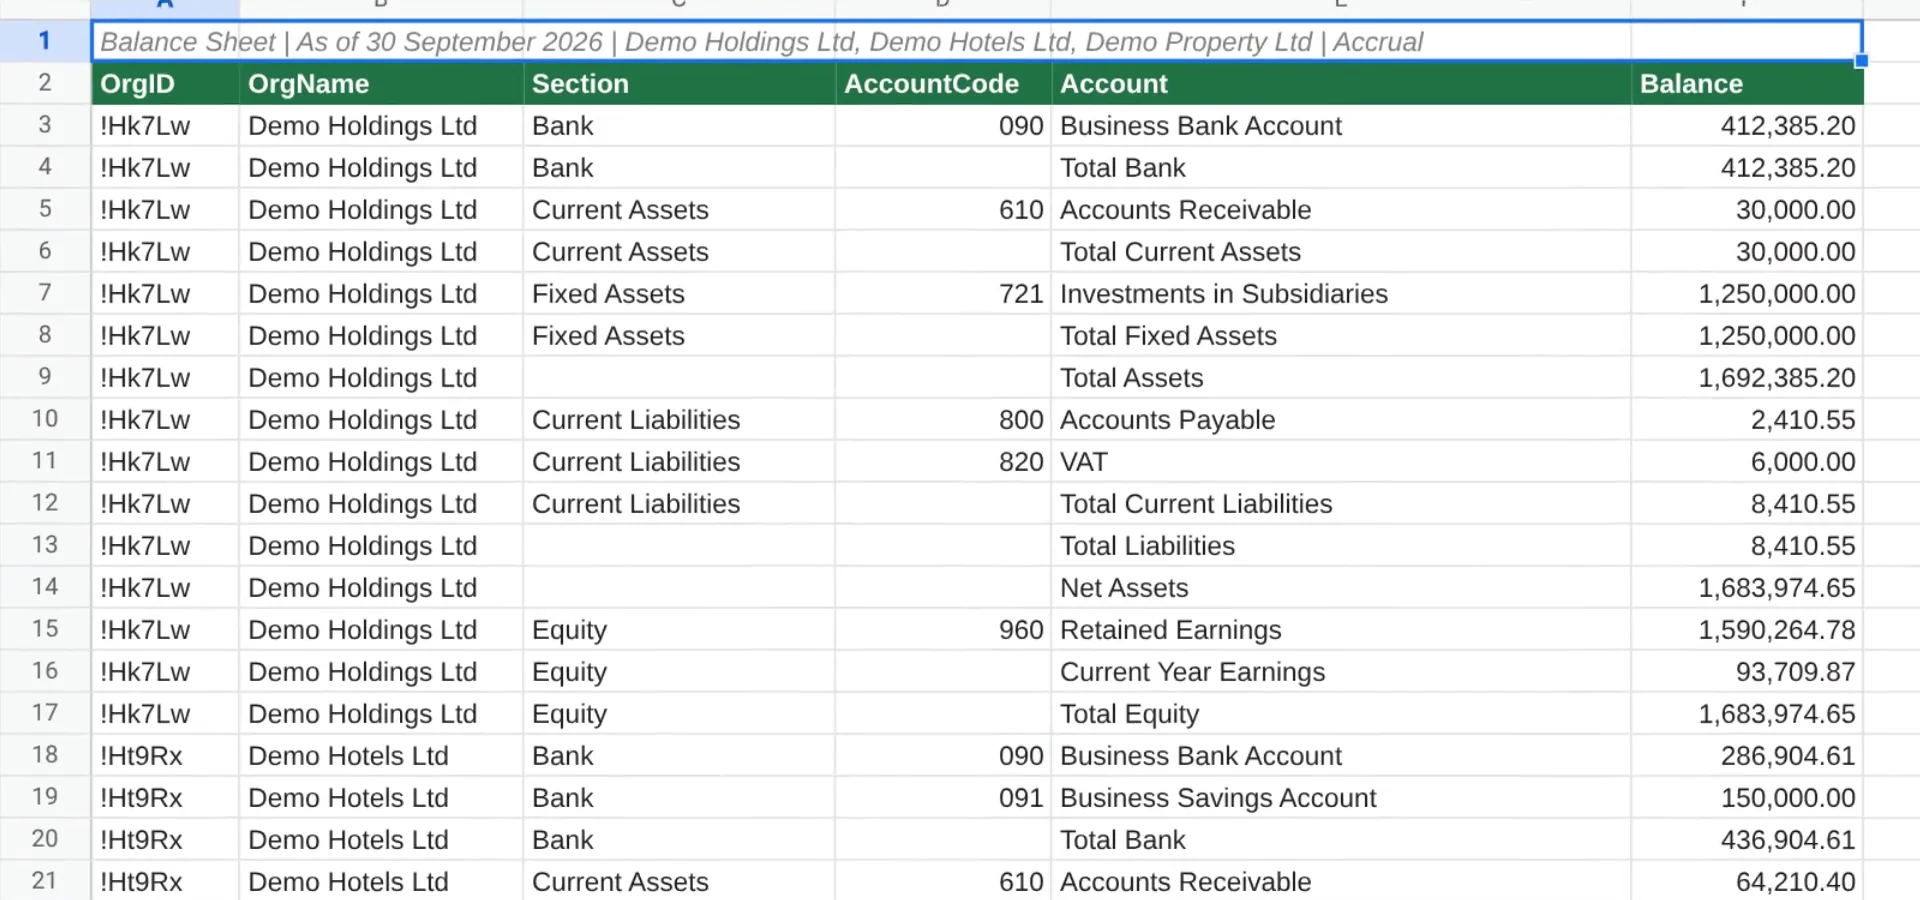
Each report lands as a filtered table with a title row that says what it is: the report, the date, the companies and the basis.
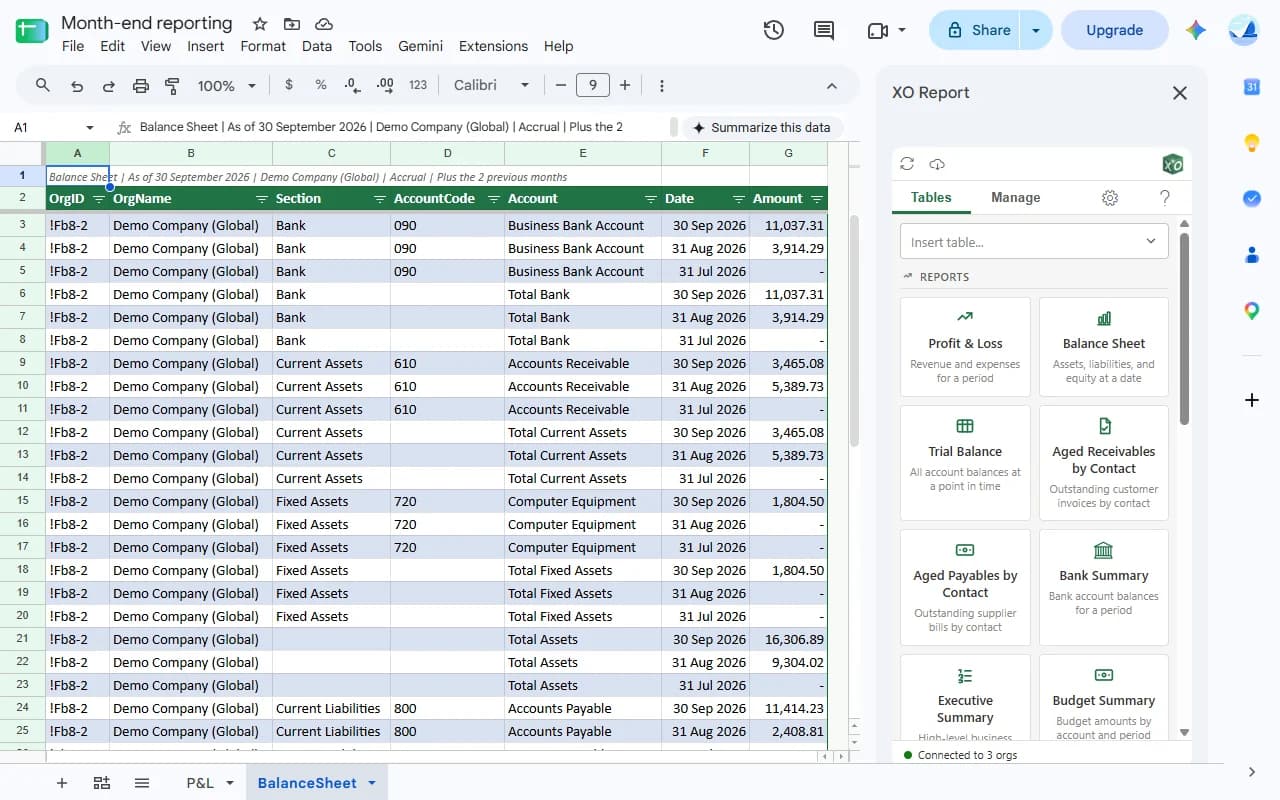
RECEIVABLES, PAYABLES, BANK
Pick the period the way you think about it.
Or read it from a cell.
The report wizard walks you through companies, date, tracking and options. The date step is where most of the monthly work disappears.
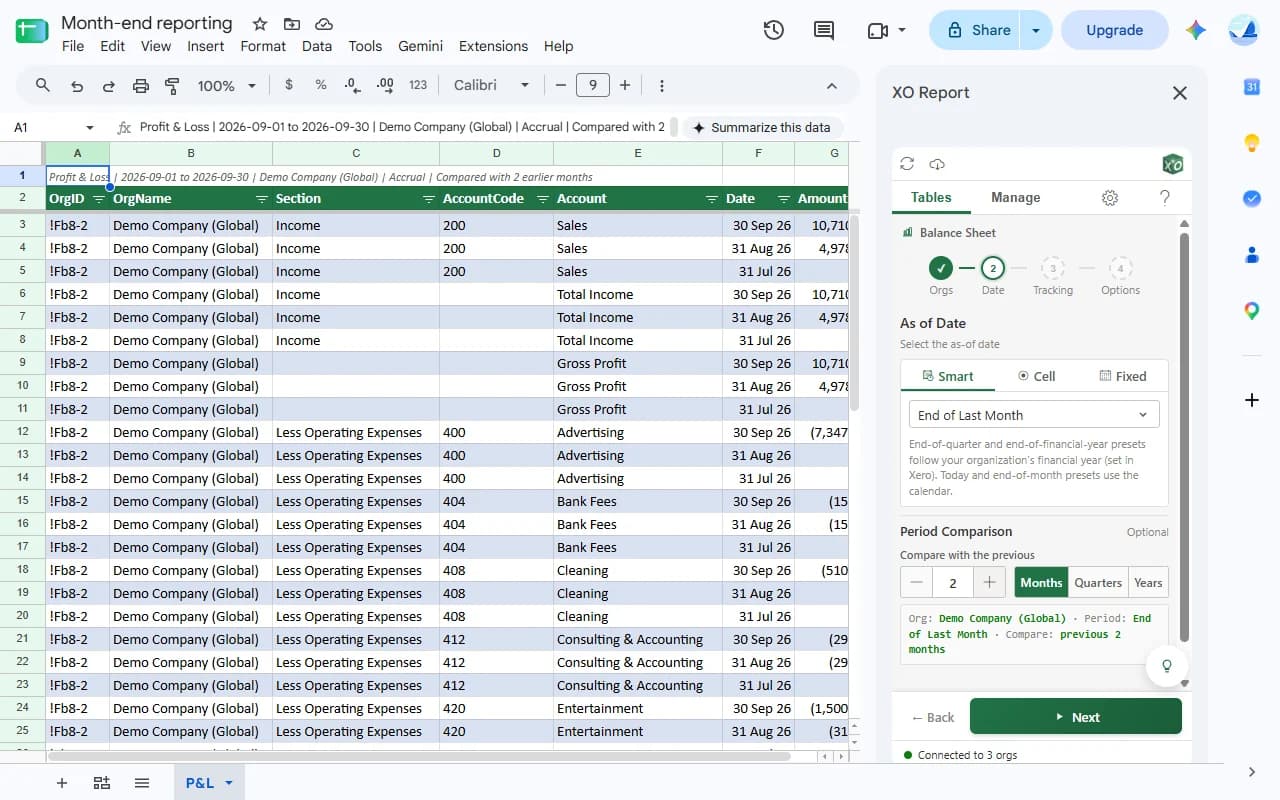
WHERE THE DATE COMES FROM
- Smart
- Presets like End of Last Month. Quarter and year-end presets follow the financial year set in Xero.
- Cell
- Point at a date in your sheet. Change the cell, refresh, and the report follows.
- Fixed
- A date or range you choose, for the file that never moves.
PERIOD COMPARISON
- Previous periods
- On the Profit & Loss and Balance Sheet, add the previous months, quarters or years to the same table.
By department, region or project.
From your Xero tracking.
Tracking categories belong to one company, so tracking works one company at a time.
Filter the Profit & Loss or Balance Sheet by up to two tracking categories. Or split the Profit & Loss by one, with rows for each account and tracking option. A split cannot be combined with period comparison.
Xero transactions and lists in Sheets.
From invoices to tax rates.
Invoices for a date range, the chart of accounts, every contact. Filter them, pivot them, look them up from your own tabs.
TRANSACTIONS
Several companies,
one table.
The first step of the report wizard is Orgs. Tick one company or several. Plans are priced by Xero organizations, with every user included, the same as in Excel.
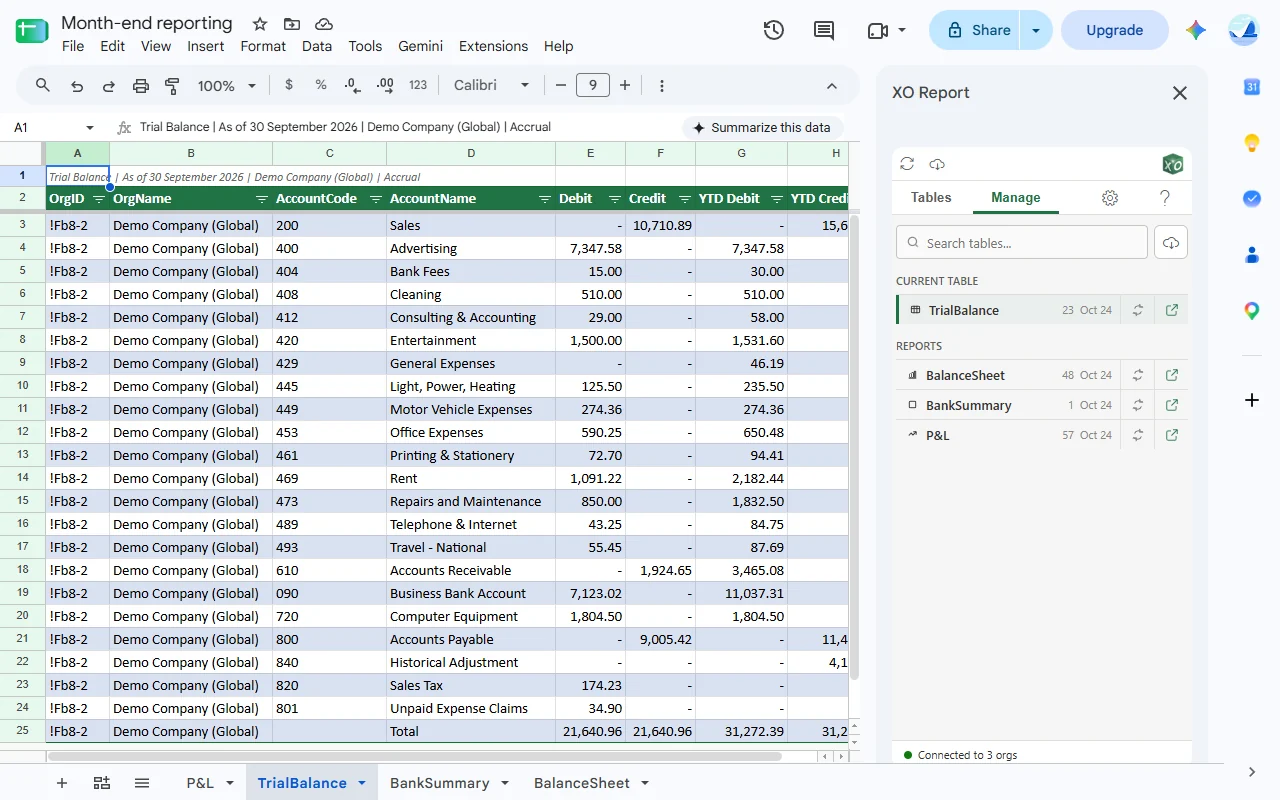
Every table in the spreadsheet, in one list.
Refresh one, or all of them.
The Manage tab shows each XO Report table, its row count and when it was last refreshed. Or use Extensions, XO Report for Xero, Refresh Data.
Install from Google's Marketplace.
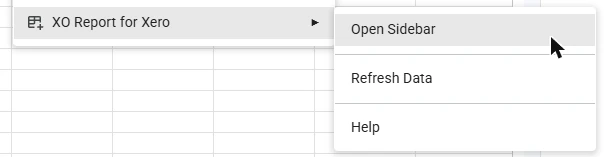
Then open the sidebar.
Connect to Xero from the sidebar and start the 14-day trial. No credit card.
1Click Install on Google Workspace Marketplace
2In any spreadsheet: Extensions, XO Report for Xero, Open Sidebar
Then click Connect to Xero, sign in on Xero's page and choose the organization to share.
3Pick a report, choose the dates, insert
Open on Google Workspace Marketplace →Install guide for Google Sheets →
Read-only access to Xero, and only the sheet you have open.
- Read-only access to Xero
- XO Report reads your Xero data. It cannot create, change or delete anything in Xero.
- Sign in with Xero
- OAuth 2.0 on Xero's own page. Your Xero password is never stored.
- One spreadsheet at a time
- The add-on sees only the spreadsheet you have open.
Questions about Google Sheets.
- Is it the same subscription as Excel?
- Yes. One XO Report subscription covers Excel and Google Sheets, with the same plans, priced by the number of Xero organizations, and unlimited users.
- What is in Excel but not in Google Sheets?
- The custom functions, such as XO.BALANCE and XO.PROFIT. Every report and every table on this page is in both. In Google Sheets you build your own layout on top of the tables, with lookups and pivot tables.
- Can I combine several Xero companies?
- Yes. Tick several organizations in the first step of the wizard and get one table, each row naming its company. The aged reports, and tracking, work one company at a time.
- How do I refresh a table?
- Open the Manage tab and click the refresh icon next to a table, or refresh them all. Or click a cell in the table and choose Extensions, XO Report for Xero, Refresh Data.
- What can the add-on see in my Google account?
- Only the spreadsheet you have open. It asks to see and edit that spreadsheet, connect to the XO Report service and show its sidebar. In Xero, access is read-only.
Try it on your own Xero file.
Try XO Report free for 14 days. No credit card required.
Free trial · No credit card · Cancel anytime