FOR FINANCE TEAMS
Month-end reporting from Xero.
One company or several.
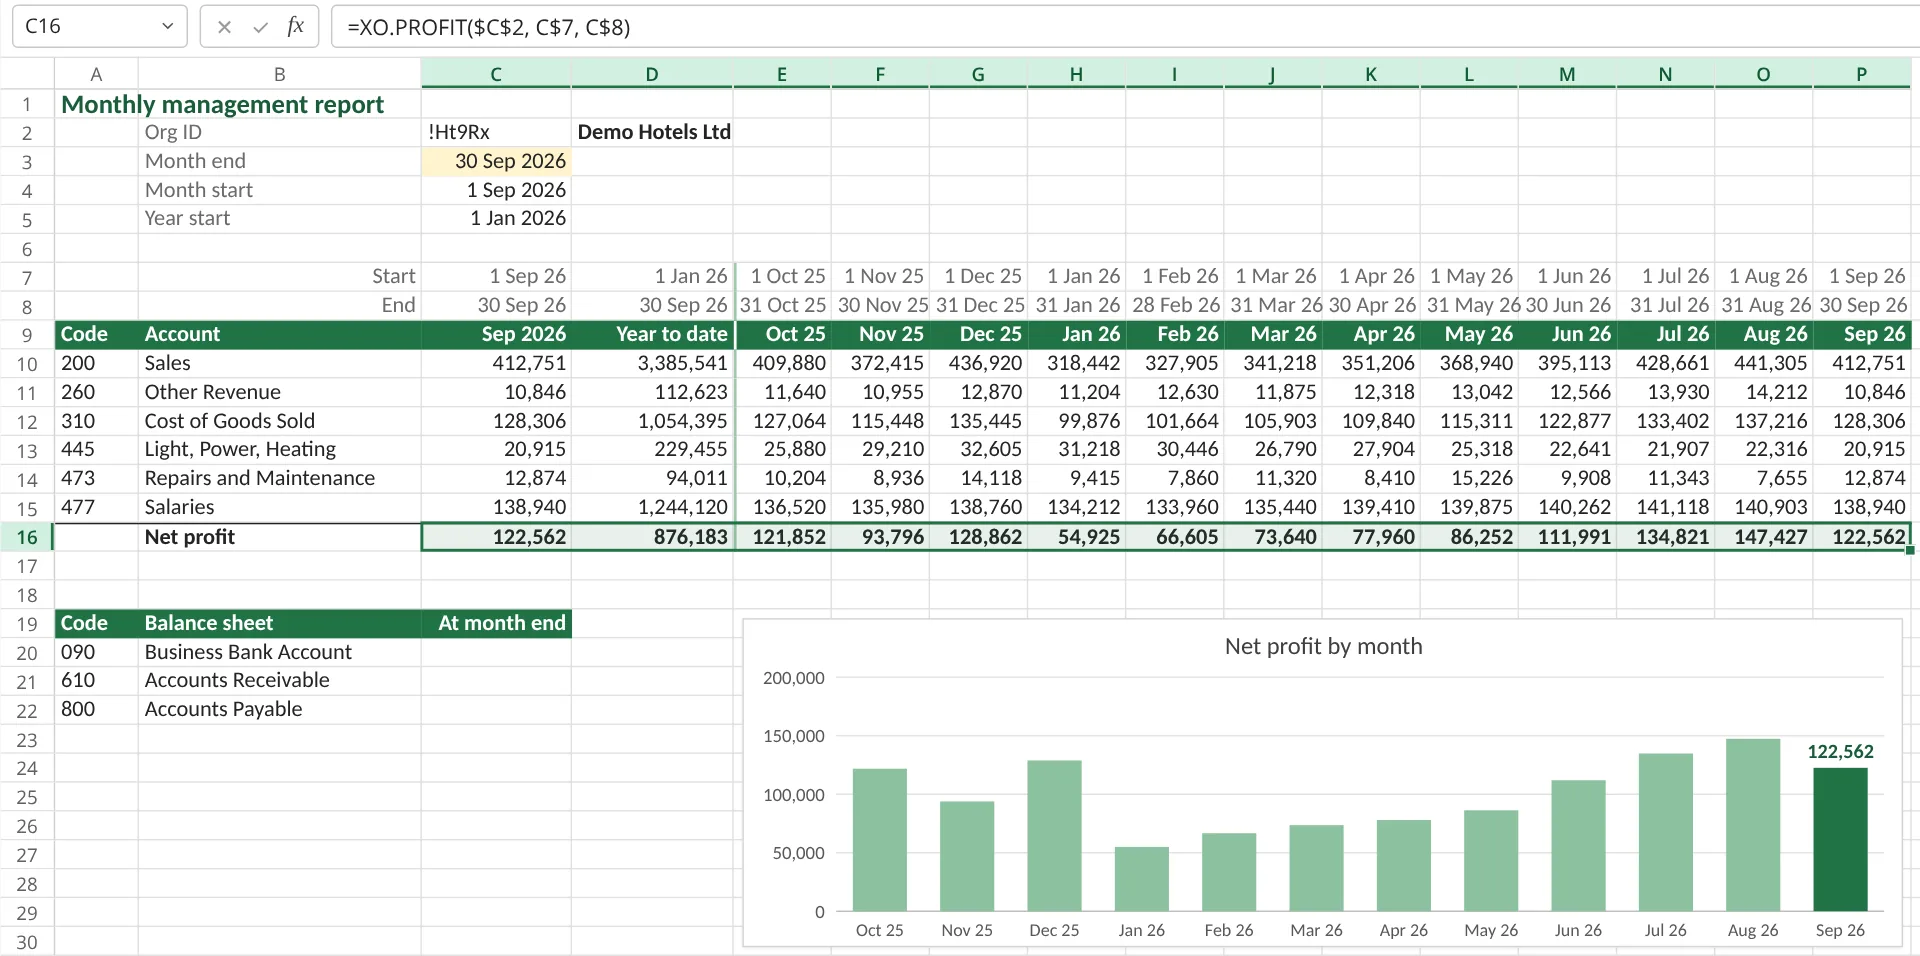
Build your management accounts once, in your own Excel or Google Sheets layout. Each month, change the dates and refresh. Every figure comes straight from Xero.
14-day free trial. No credit card. Excel and Google Sheets.
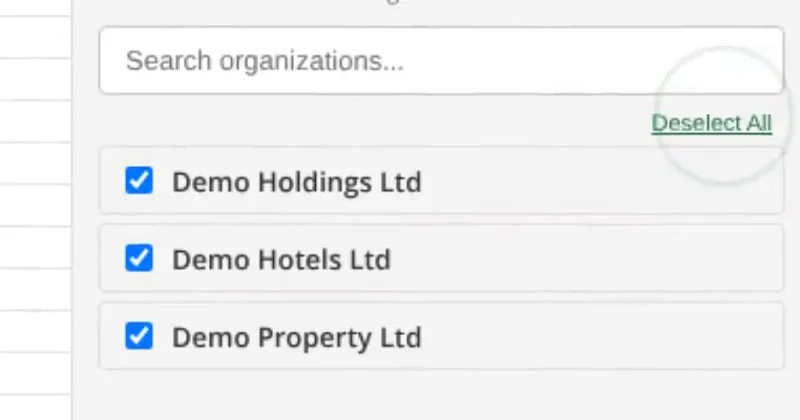
Every company in one list.
Connect each one once.
Sign in with Xero for each organisation. Xero adds one per sign-in. After that, pick the company when you insert a report or write a formula.
Priced by organisations, not people. Plans go from one Xero organisation up to 50, with unlimited users on every plan.
One subscription, both apps. The same plan covers Excel and Google Sheets.
The reports you rebuild every month.
Built once, refreshed after.
Reports land as tables you can filter and pivot. Formulas sit in your own layout. Both refresh from Xero.
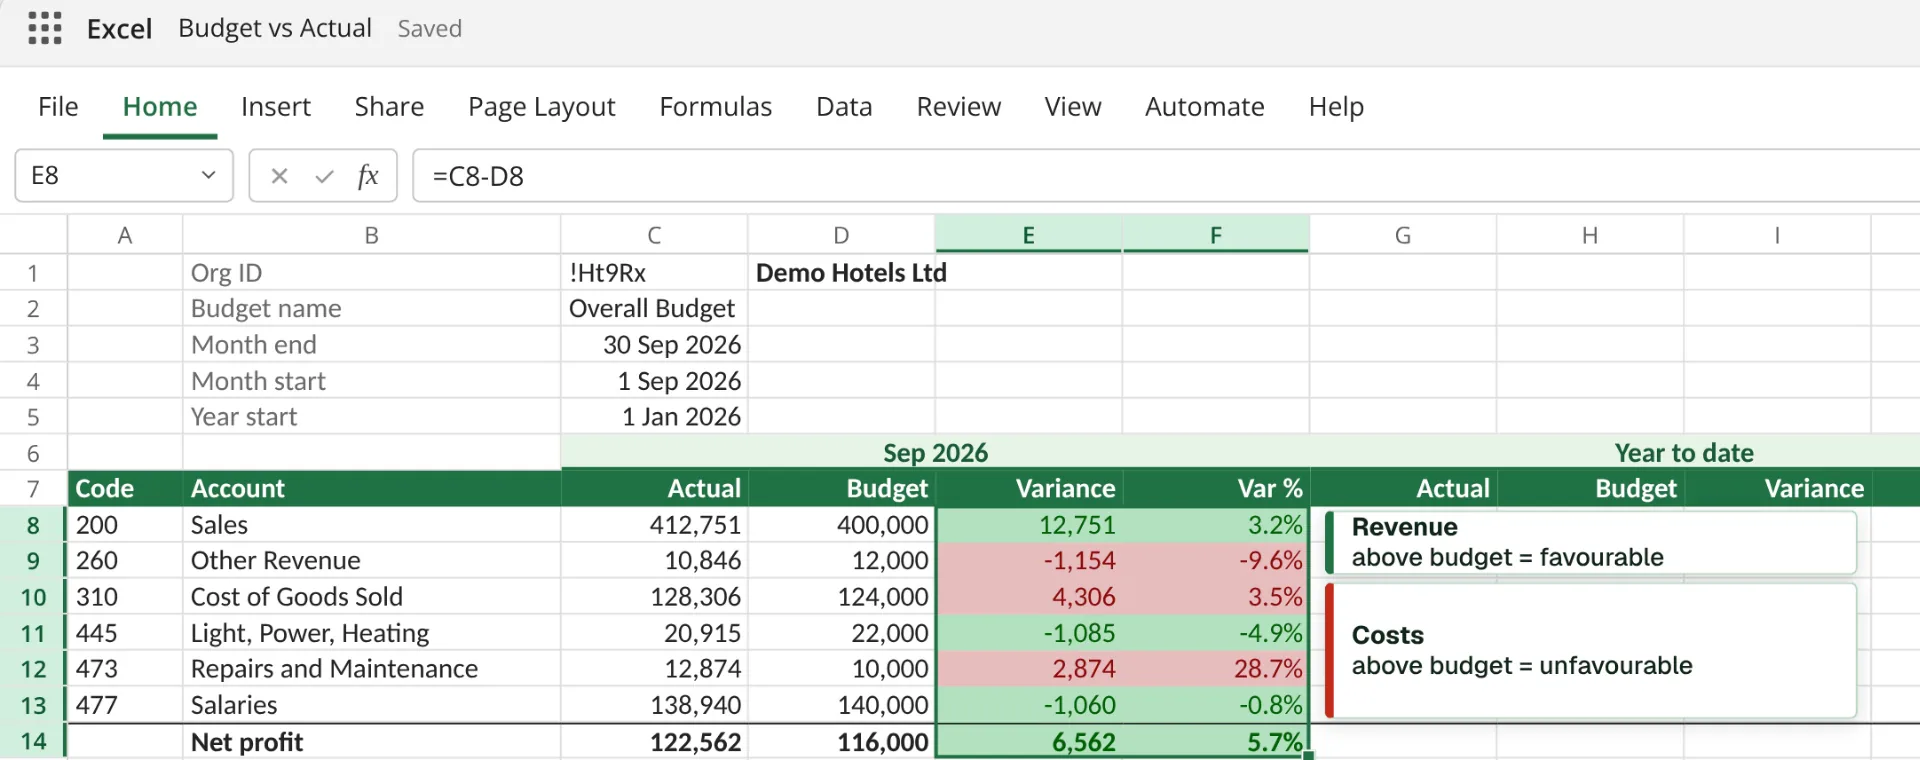
Budget against actual
In Excel, put XO.BUDGET beside XO.BALANCE for each account and work out the variance in plain Excel; XO.BUDGET reaches your named and tracking budgets too. In Excel or Google Sheets, insert the Budget Summary report (your Overall Budget, by account and month) beside a Profit & Loss table and compare them with lookups.
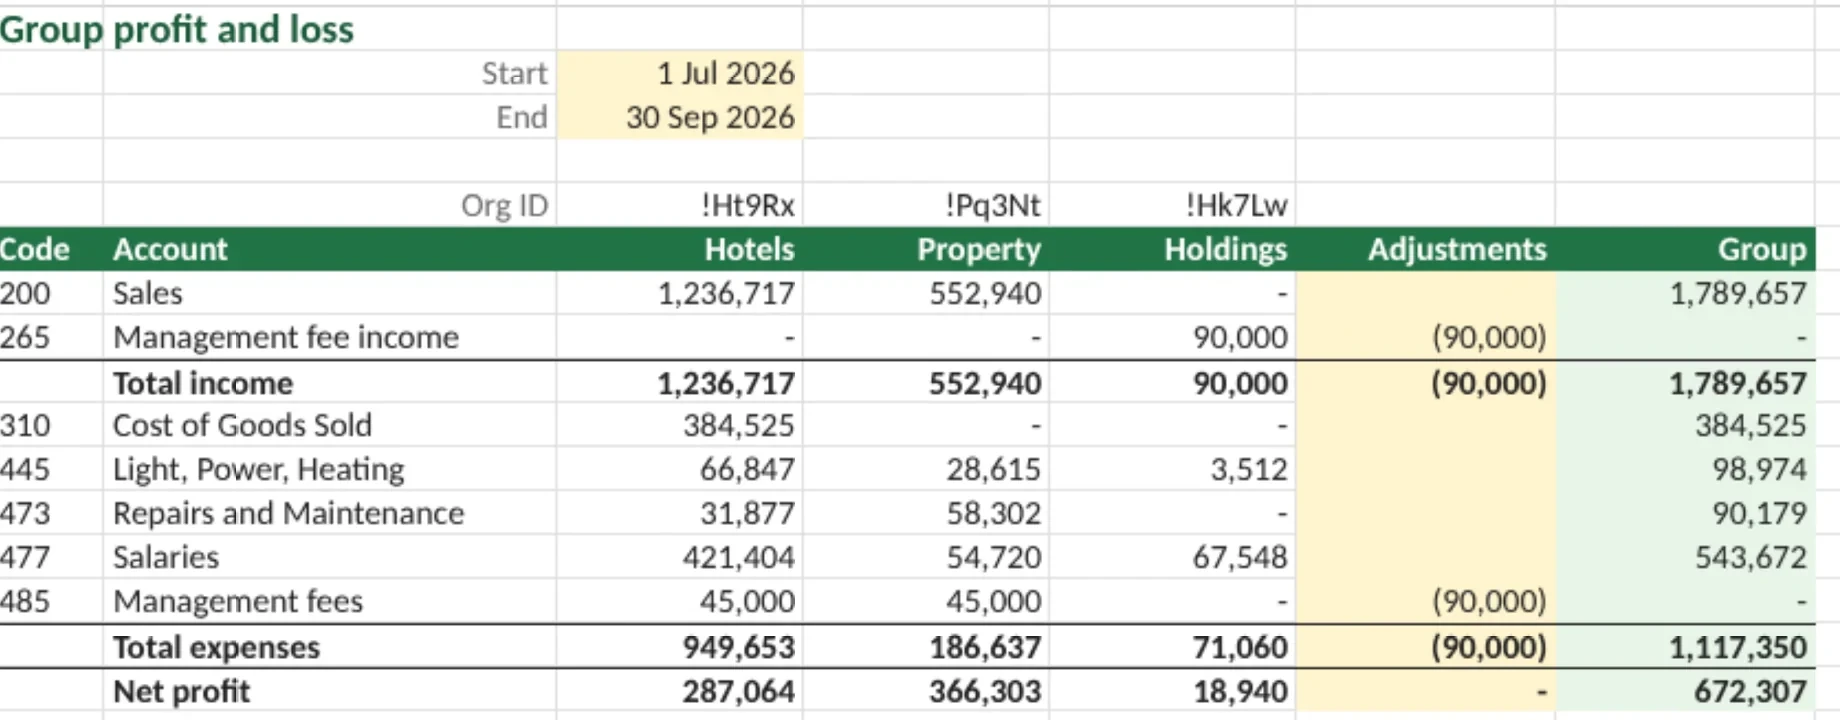
Several companies, one view
Insert one report for several companies, each row naming its company, in Excel or Google Sheets, then pivot it. In Excel you can also give each company its own column of XO.BALANCE formulas, add your adjustments in a column of your own and total the group. Everything refreshes from Xero.
The balance sheet at month end
Insert the Balance Sheet at any date, for one company or several in one table. Add the Bank Summary and the aged reports, and the month-end file is ready to review.
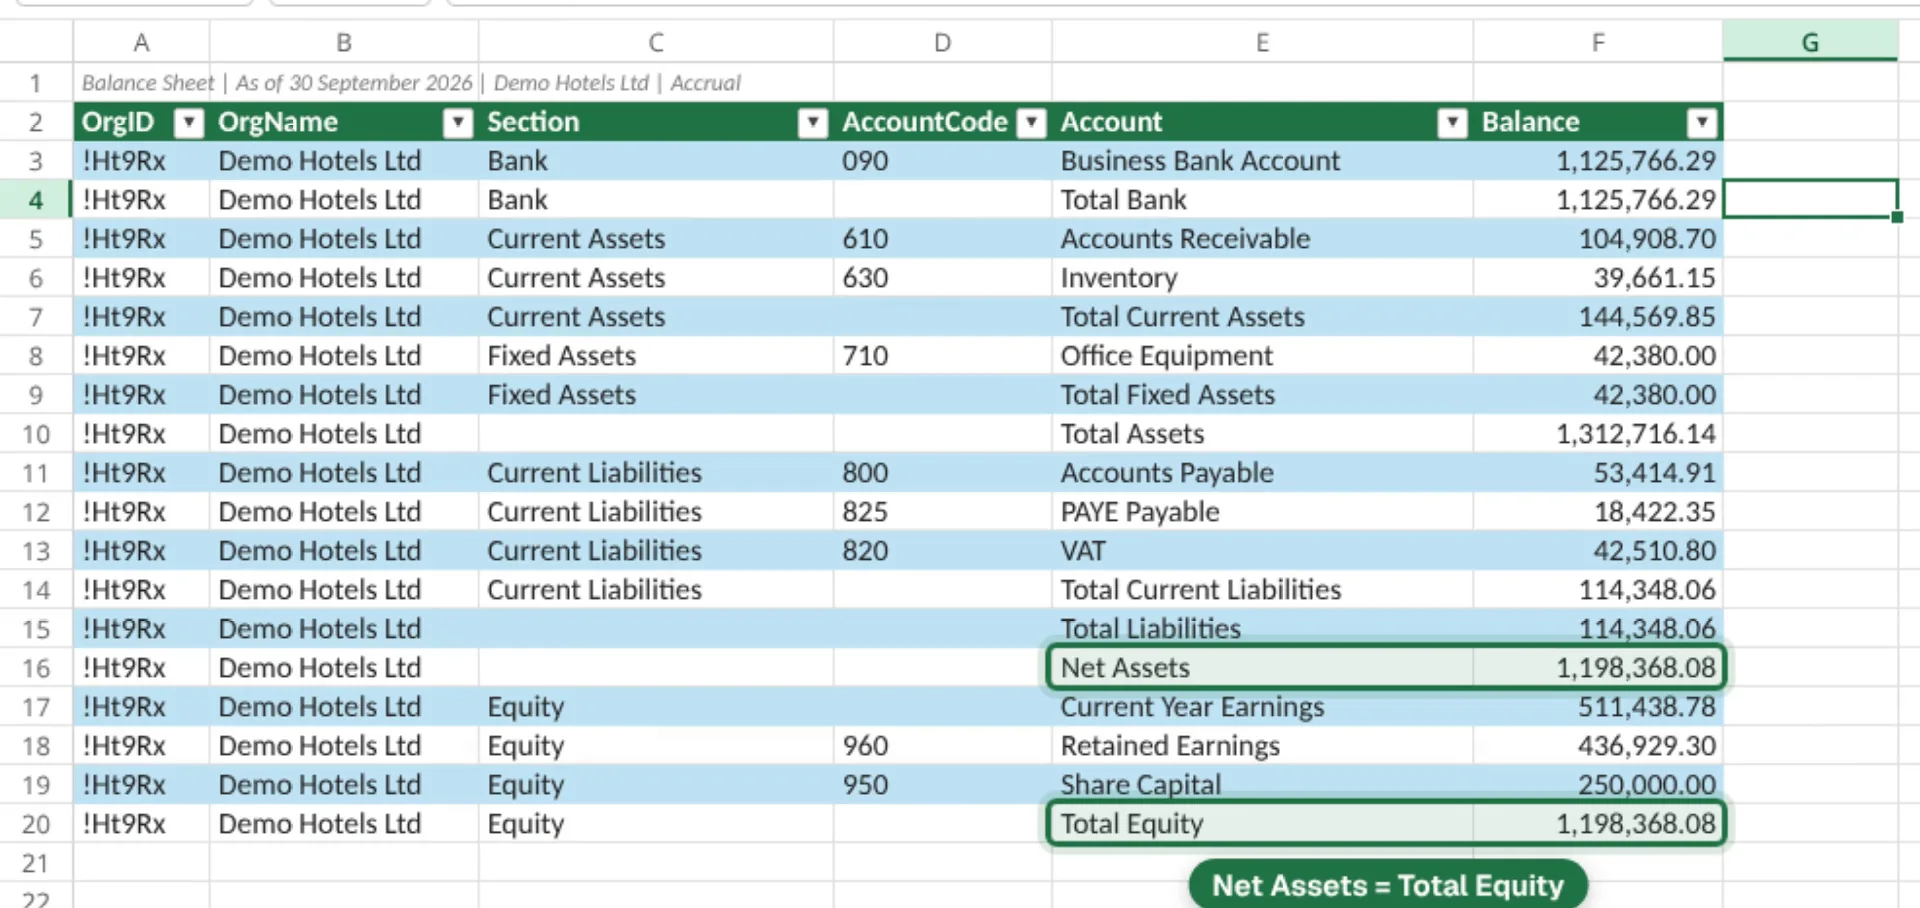
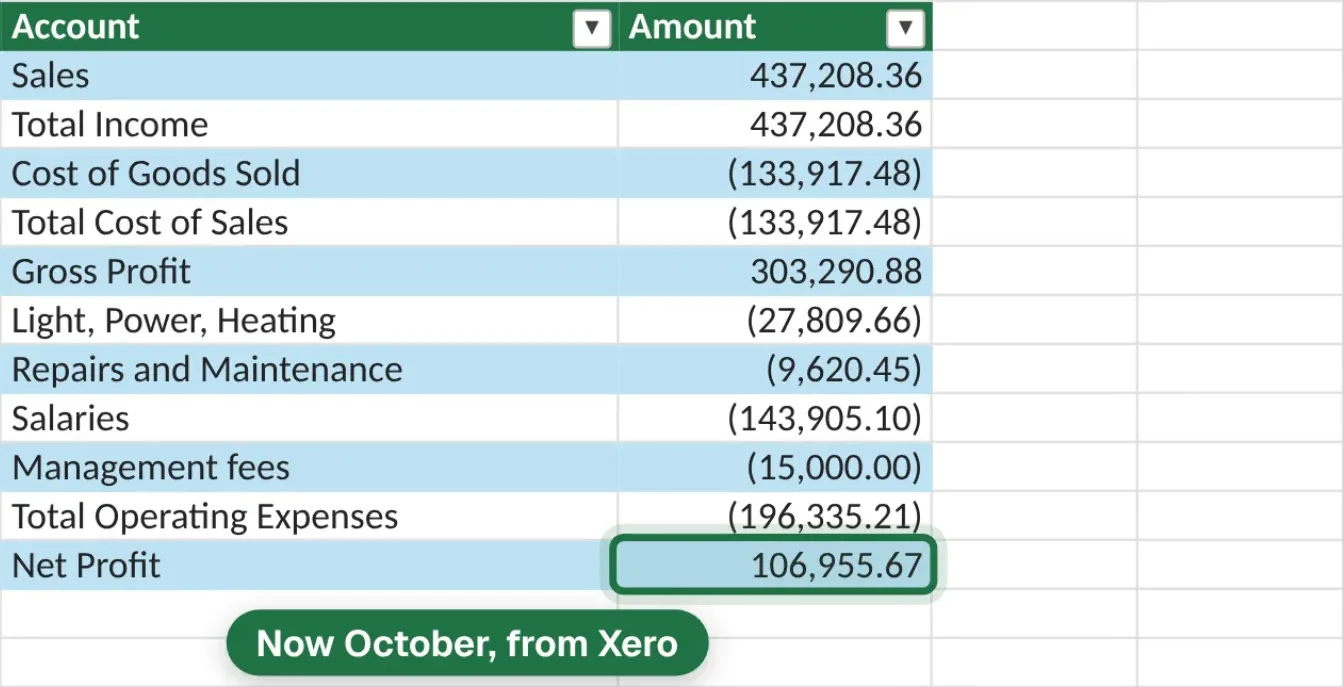
Next month, change the dates.
Then press Refresh.
The layout stays. The figures come again from Xero. The Refresh button in the add-in fetches fresh data from Xero; ordinary recalculation can reuse recent figures to keep the file quick.
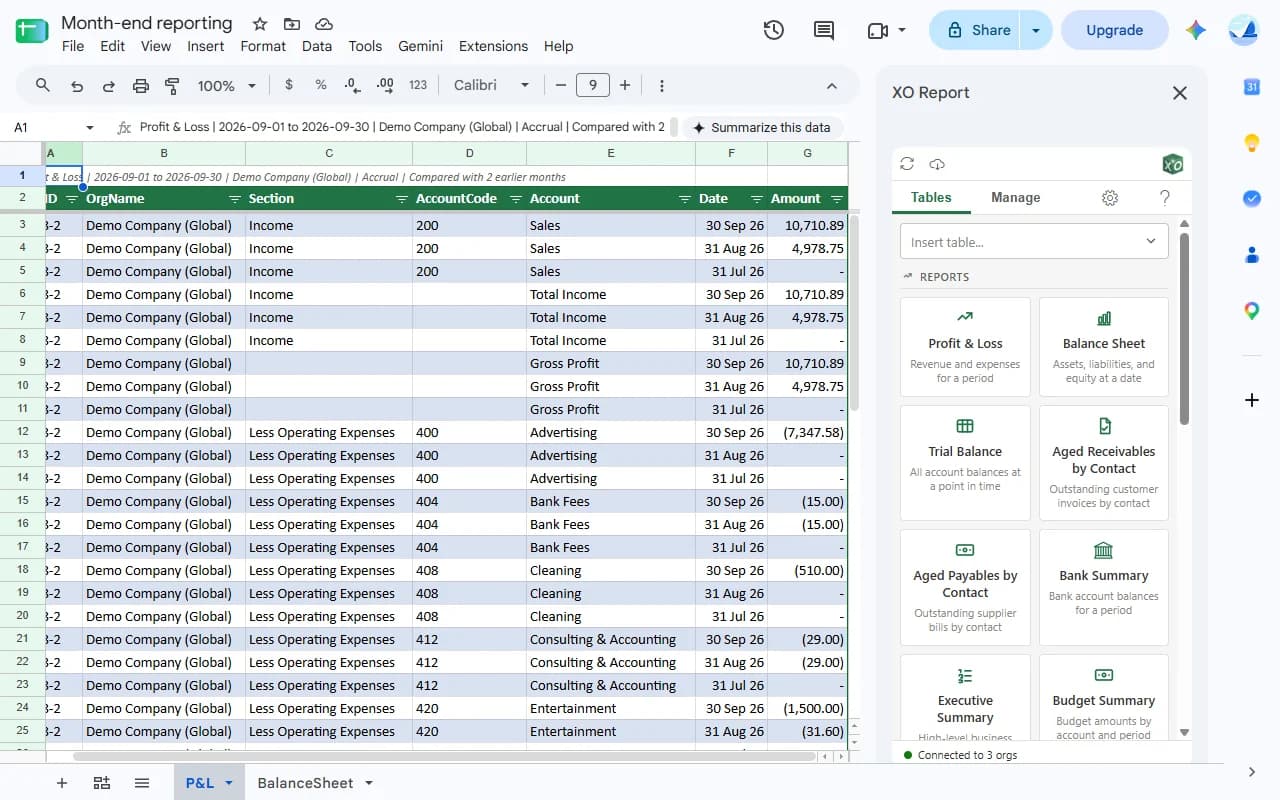
Part of the team works in Google Sheets?
Same reports, same plan.
The reports and tables are in the Google Sheets sidebar too, with the same companies, dates and refresh. The custom functions, such as XO.BALANCE, are Excel only.
Priced by the number of organisations.
Unlimited users.
Every plan has every product feature and a 14-day free trial. For more than 50 organisations, ask us about Enterprise.
SOLO
1 organisation
US$9.90 a month
LITE
3 organisations
US$14.90 a month
PRO
10 organisations
US$29.90 a month
BUSINESS
25 organisations
US$49.90 a month
MAX
50 organisations
US$99.90 a month
- Read-only access to Xero
- XO Report reads Xero data. It cannot create, change or delete anything in Xero.
- Sign in with Xero
- OAuth 2.0 on Xero's own page. Xero passwords are never stored.
- Excel or Google Sheets
- Excel on Windows, Mac and the web, and Google Sheets.
Questions finance teams ask.
- We only have one Xero company. Is it for us?
- Yes. The Solo plan covers one Xero organisation for US$9.90 a month, with every feature and unlimited users. If you add companies later, move to a larger plan.
- Can the whole finance team use it?
- Yes. Every plan has unlimited users. You pay for the number of Xero organisations, not the number of people.
- How do I report across several companies?
- Connect each company once from Settings; Xero adds one per sign-in, and your Xero login needs access to that company, with Xero's Connect apps permission. Then insert a report for several companies in one table and pivot it, or in Excel give each company its own column of formulas. Eliminations, currency translation and ownership percentages go in your own columns, so the method stays yours.
- Can XO Report change anything in Xero?
- No. Access is read-only. XO Report reads reports, balances and lists, and cannot create, change or delete anything in Xero.
- Does it work in Google Sheets?
- Yes for the reports and tables, under the same subscription. The custom functions, such as XO.BALANCE and XO.BUDGET, are Excel only.
Try it on your own Xero.
Connect your companies and build your first report. 14-day free trial, no credit card.
14-day trial · No credit card required · 30-day money-back guarantee