 XERO TO GOOGLE SHEETS
Xero to Google Sheets.
Tables that refresh, not CSVs.
XO Report is a Google Sheets add-on for Xero. Insert your reports and lists from a sidebar as clean tables, then refresh them when Xero changes. For one company or several.
14-day free trial, no credit card. Installs from Google Workspace Marketplace.
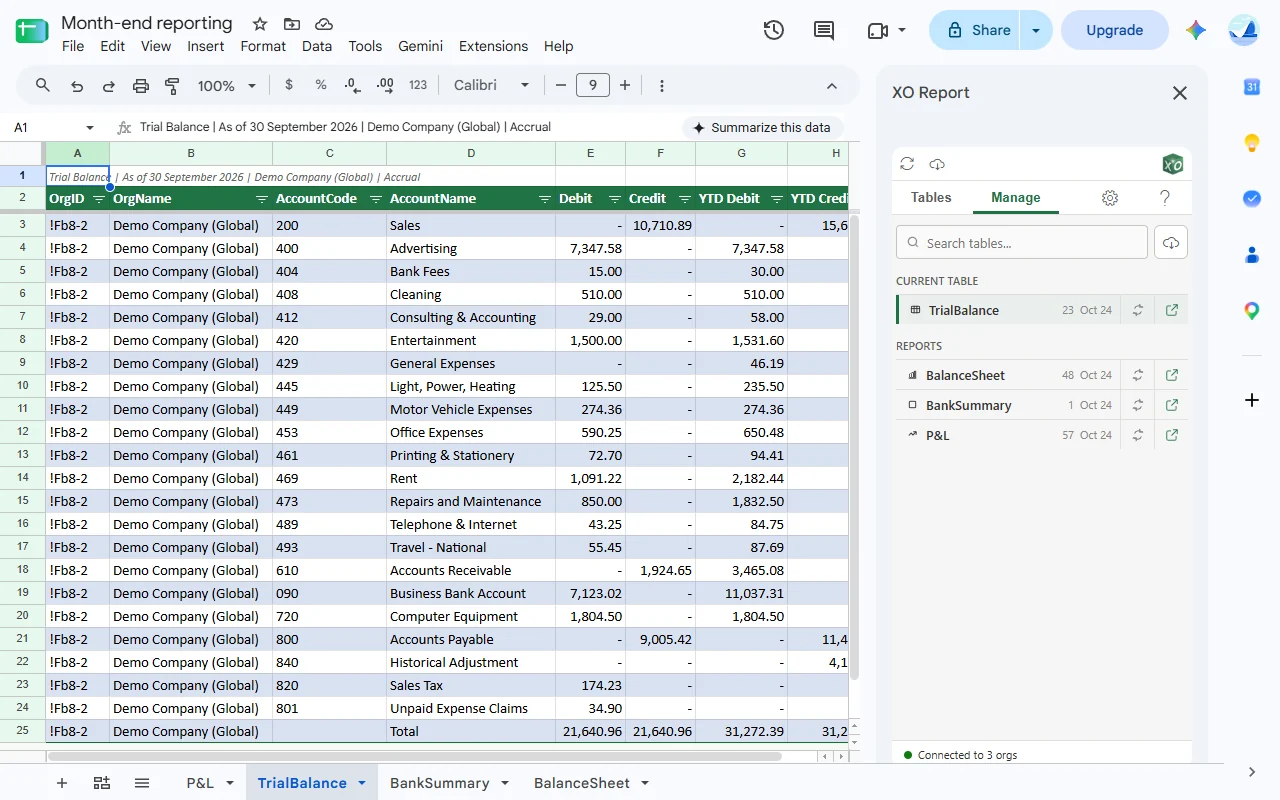
Two ways to get Xero into Google Sheets.
Only one keeps up with Xero.
Xero's own export gives you a copy of the day. An add-on keeps the table linked, so next month is a refresh, not a redo.
XERO'S OWN EXPORT
Export a copy
- In Xero, go to Reporting, then All reports, open the report, set the dates and click Update.
- Click Export and choose Google Sheets.
- Invoices, contacts and the chart of accounts download as CSV files instead: bring them in with File, Import in Google Sheets.
Free and fine for a one-off. But it is a copy: after a late bill you export again, and with several companies you do each one in turn.
XO REPORT ADD-ON
Insert once, then refresh
- Open the XO Report sidebar and pick a report or a list, the companies and the dates.
- Click Insert. It lands on its own tab as a formatted table with filters.
- When Xero changes, click Refresh. The same table updates where it is.
Most reports and lists can bring several companies back in one table. Access to Xero is read-only.
Xero reports, as Sheets tables.
Named, dated, ready to use.
Each report lands with a title row that says what it is: the report, the date, the companies and, where it applies, the basis.
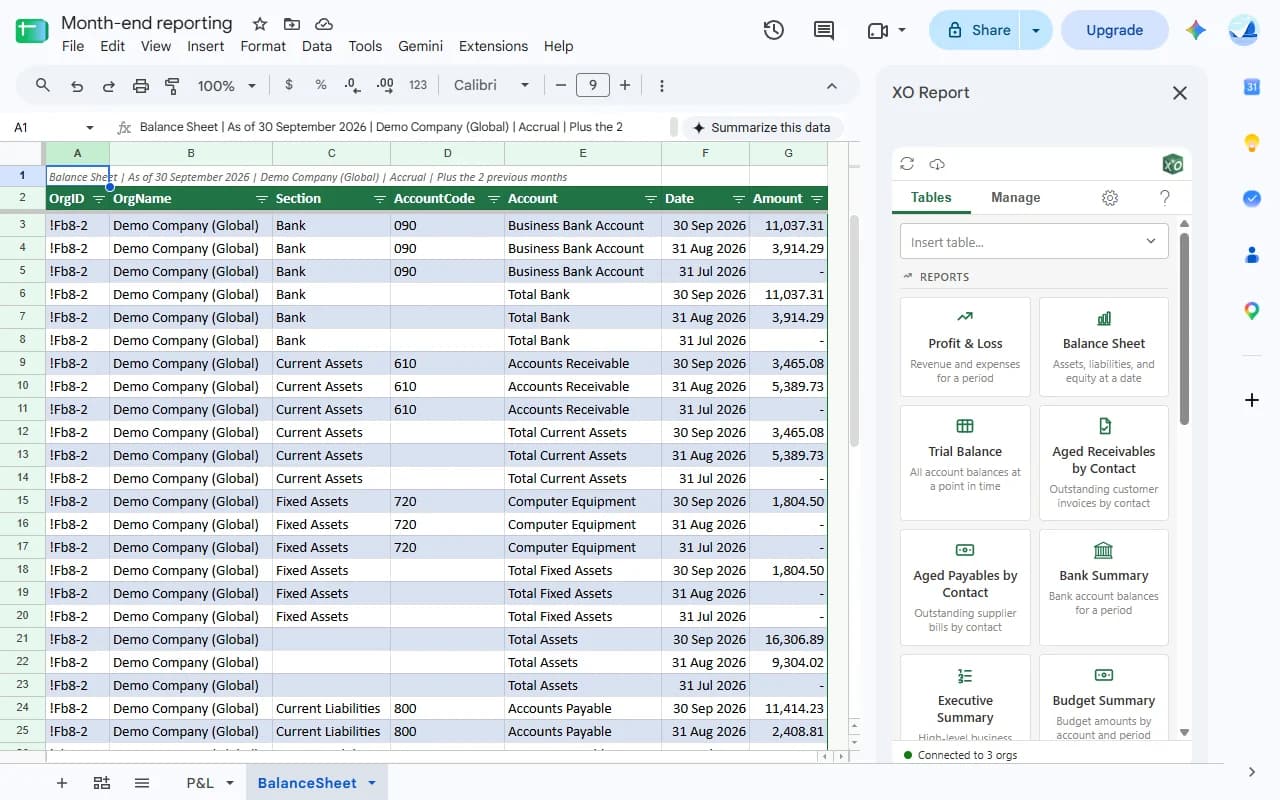
The sidebar has the statements (Profit & Loss, Balance Sheet, Trial Balance, Executive Summary, Budget Summary), the aged receivables and payables, Bank Summary, and lists such as invoices, bills, payments, contacts and the chart of accounts. The report guides on this site show Excel. The sidebar steps are the same in Google Sheets; the sections on formulas such as XO.BALANCE are Excel only.
REPORT GUIDES
- Profit & LossThe monthly P&L, with earlier months beside it
- Balance SheetAssets, liabilities and equity at a month-end
- Trial BalanceDebits, credits and year to date for the month-end file
- Aged ReceivablesWho owes what, aged at the date you pick
- Several companiesCompanies side by side, with your own group total
Pick the period once.
Next month, just refresh.
Choose Last Month or End of Last Month and the report moves with the calendar every time you refresh.
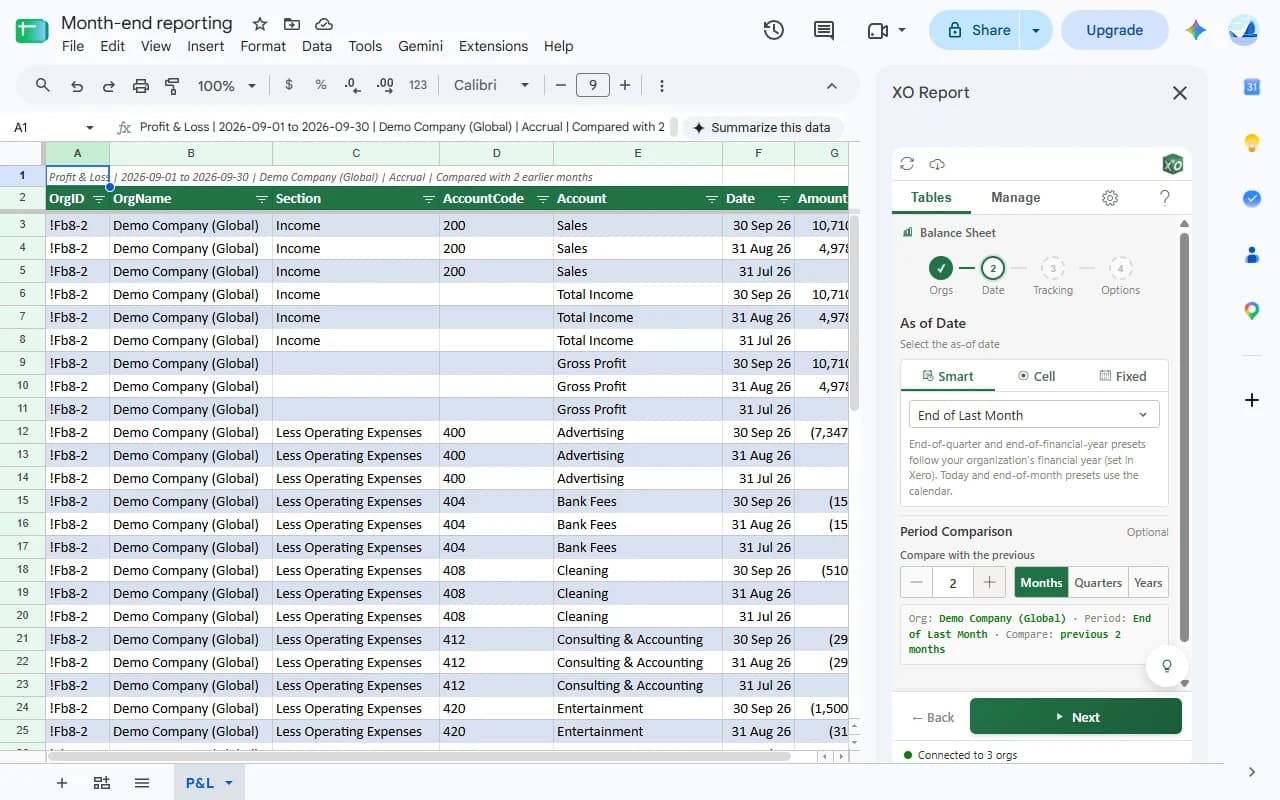
Smart. Presets such as Last Month or This Financial Year, read again on every refresh. Year presets follow the year end set in Xero.
Cell. Point at a date in your sheet. Change the cell, refresh, and the report follows.
Previous periods. Put the months, quarters or years before it in the same Profit & Loss or Balance Sheet table.
Several Xero companies,
one table.
Tick the companies you want when you insert. Each row names its company, so a SUMIFS or a pivot table gives the group view.
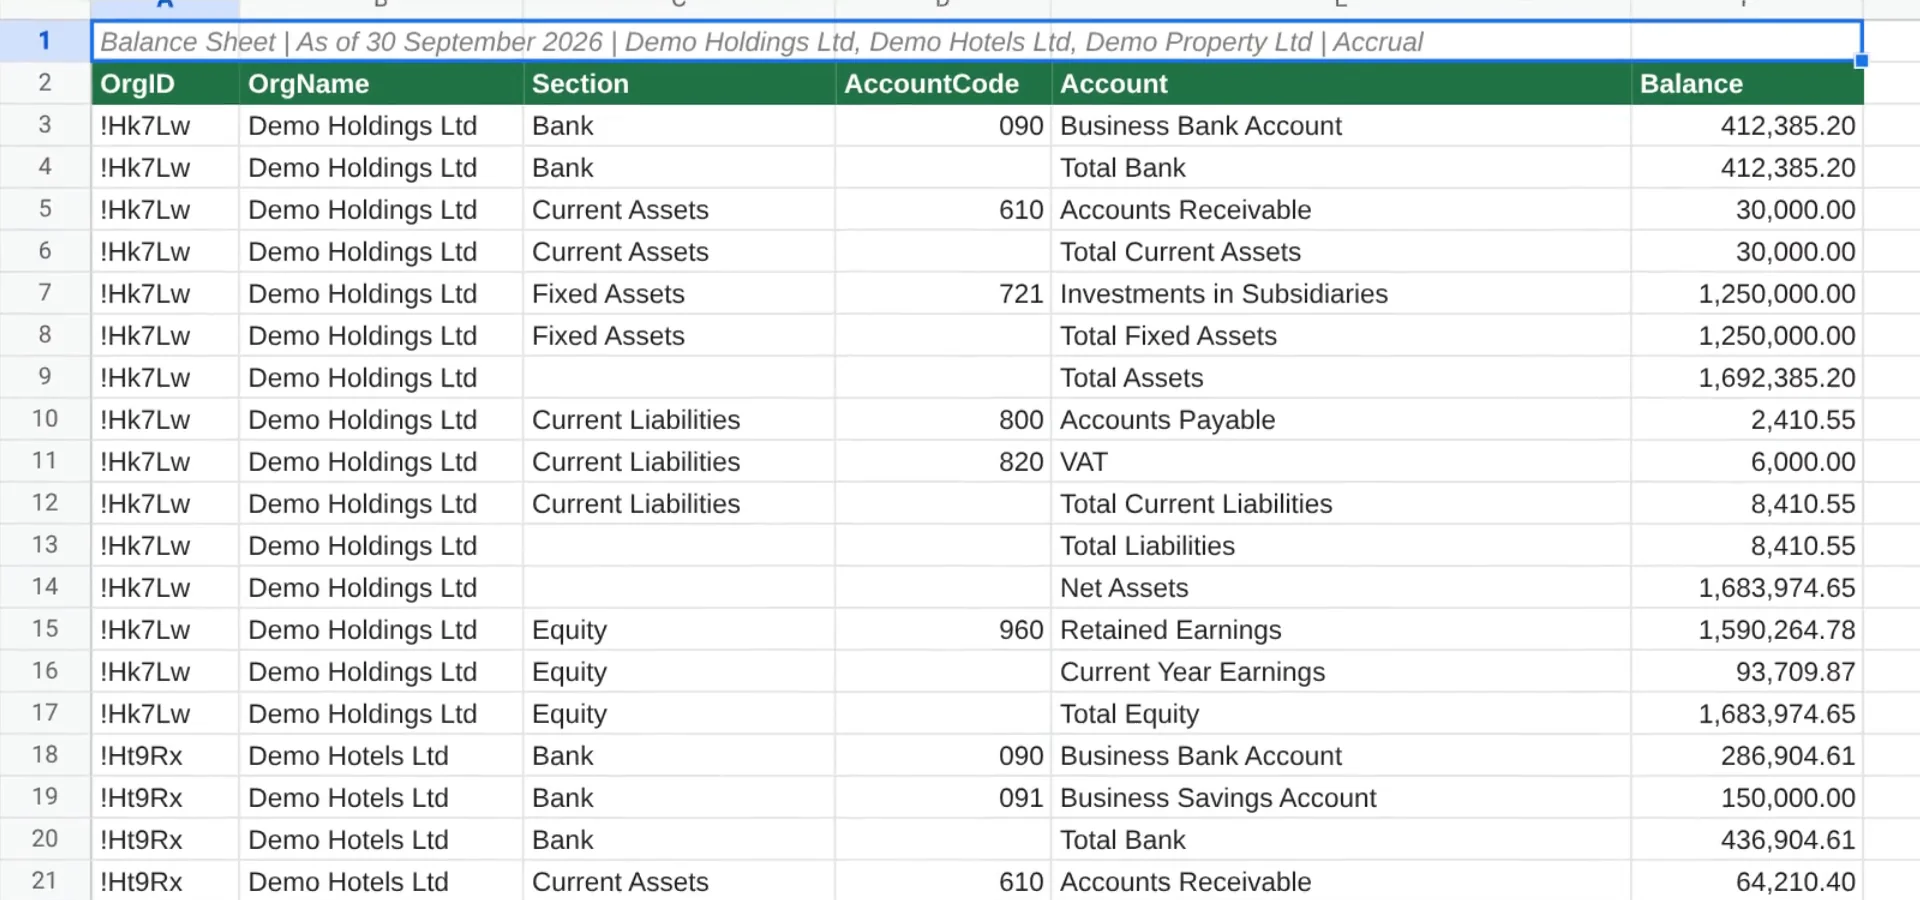
Most reports and lists can combine companies; the aged reports, and reports filtered by a tracking category, work one company at a time. Plans go by the number of Xero companies, with every user included. Several companies, step by step →
Xero changed? Refresh.
One table, or all of them.
No new export, no rows to delete, no formats to fix.
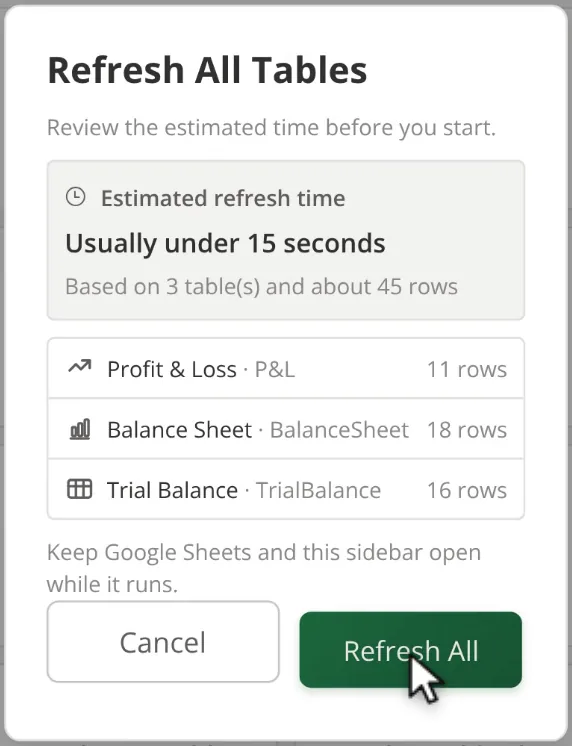
The sidebar's Manage tab lists every XO Report table in the spreadsheet, with its own refresh button. Refresh all (the cloud icon at the top of the sidebar, also on the Manage tab) does every table at once, after showing you how long it should take.
Each table updates where it is, so lookups and charts that point at its columns pick up the new figures. Refresh runs while the spreadsheet and the sidebar are open; nothing runs on a schedule.
Build your monthly pack on it.
With the lookups you already use.
The tables are plain Google Sheets data, so everything you know works on them.
Look it up. SUMIFS on the account and the date, or VLOOKUP and XLOOKUP, pull figures from the report tabs into your own summary tab.
Pivot and chart it. Each report has a title row, then one header row. Start pivots at the header row, and tick Hide Totals before you sum amounts. Point pivots and charts at whole columns and they follow every refresh.
Budget next to actual. Insert the Budget Summary beside the Profit & Loss and match budget lines by account name to work out the variance.
Custom formulasOnly in Excel
=XO.BALANCE and the other custom formulas put a single Xero figure straight in a cell. They come with the same subscription. Xero to Excel →
Watch it in 80 seconds.
Three reports, one refresh.
A Profit & Loss, a Balance Sheet and a Trial Balance on three tabs, then Refresh all after a late bill in Xero.
Questions people ask.
- Can I export Xero to Google Sheets for free?
- Yes. In Xero, open a report under Reporting, All reports, click Export and choose Google Sheets. Invoices, contacts and the chart of accounts download as CSV files, which you bring in with File, Import in Google Sheets. Each export is a copy of that day, so after any change in Xero you export again, one company at a time.
- Is there a Xero to Google Sheets integration that refreshes?
- XO Report is a Google Sheets add-on that inserts your Xero reports and lists as tables and refreshes them when you click Refresh in its sidebar. The table updates where it is, with the latest figures from Xero. Refresh runs while the spreadsheet is open; nothing runs on a schedule.
- Can XO Report change anything in Xero?
- No. Its access to Xero is read-only, so it can read your figures but cannot create, change or delete anything. You sign in on Xero's own page, so your Xero password is never seen or stored, and the add-on only sees the spreadsheet you have open.
- Can I put several Xero companies in one Google Sheet?
- Yes. Tick several companies when you insert a report or a list, and you get one table with a column naming each row's company. The aged reports, and reports filtered by a tracking category, work one company at a time. Plans go by the number of companies: Solo 1, Lite 3, Pro 10, Business 25, Max 50.
- Can I build a monthly management pack in Google Sheets?
- Yes. Insert the reports you need on their own tabs, then build your summary tab with VLOOKUP, XLOOKUP or SUMIFS on the account and the date, plus pivot tables and charts. Next month, change the dates if you need to and refresh: every lookup picks up the new figures.
- What is the difference with XO Report for Excel?
- The reports, lists, date choices and refresh are the same, and one subscription covers both. Excel can also lay out comparison periods as columns, and it has custom formulas, such as XO.BALANCE, that put a single Xero figure in a cell. In Google Sheets you get the same figures from the tables, with your own lookups.
- How much does it cost?
- There is a 14-day free trial with no credit card. Plans start at US$9.90 a month for Solo (1 company) and go up to US$99.90 a month for Max (50 companies), with every user included. Enterprise covers more than 50.