XO Report vs
Flex Financial Reporting
Flex Financial Reporting is one of the most-reviewed Excel apps on the Xero App Store. Flex works from data tables you insert. XO Report has tables too, plus formulas you type in any cell, and a Google Sheets add-on.
14-day free trial. No credit card.
The short answer.
It depends on how you work.
Both bring Xero data into a spreadsheet. Here is who each one suits best.
Choose Flex Financial Reporting if:
- You need Journals or GL transaction detail
- You prefer ready-made data tables to formulas
- You already use Flex and it works for you
Choose XO Report if:
- You want formulas in your own layouts, not only data tables
- You need exact mid-month balances in a cell
- You report on a few companies and want a lower entry price
- Some of your team work in Google Sheets
The fair view
of Flex Financial Reporting.
What Flex Financial Reporting does well, and what to know before you choose it.
Strengths
- One of the most-reviewed Excel apps on the Xero App Store
- Data tables for invoices, contacts and more
- A Combine Tool that merges tables from several organizations
- Journals and GL transactions
- Unlimited users on all plans
- Works in Excel on Windows, Mac and the web
Limitations
- No custom worksheet functions like =XO.BALANCE: you insert data tables and refresh them
- Starts at AU$60/mo ex GST, even for one organization
- A December 2025 Xero App Store review says its monthly-comparison P&L tables can leave out transactions dated the 31st
Where XO Report
is different.
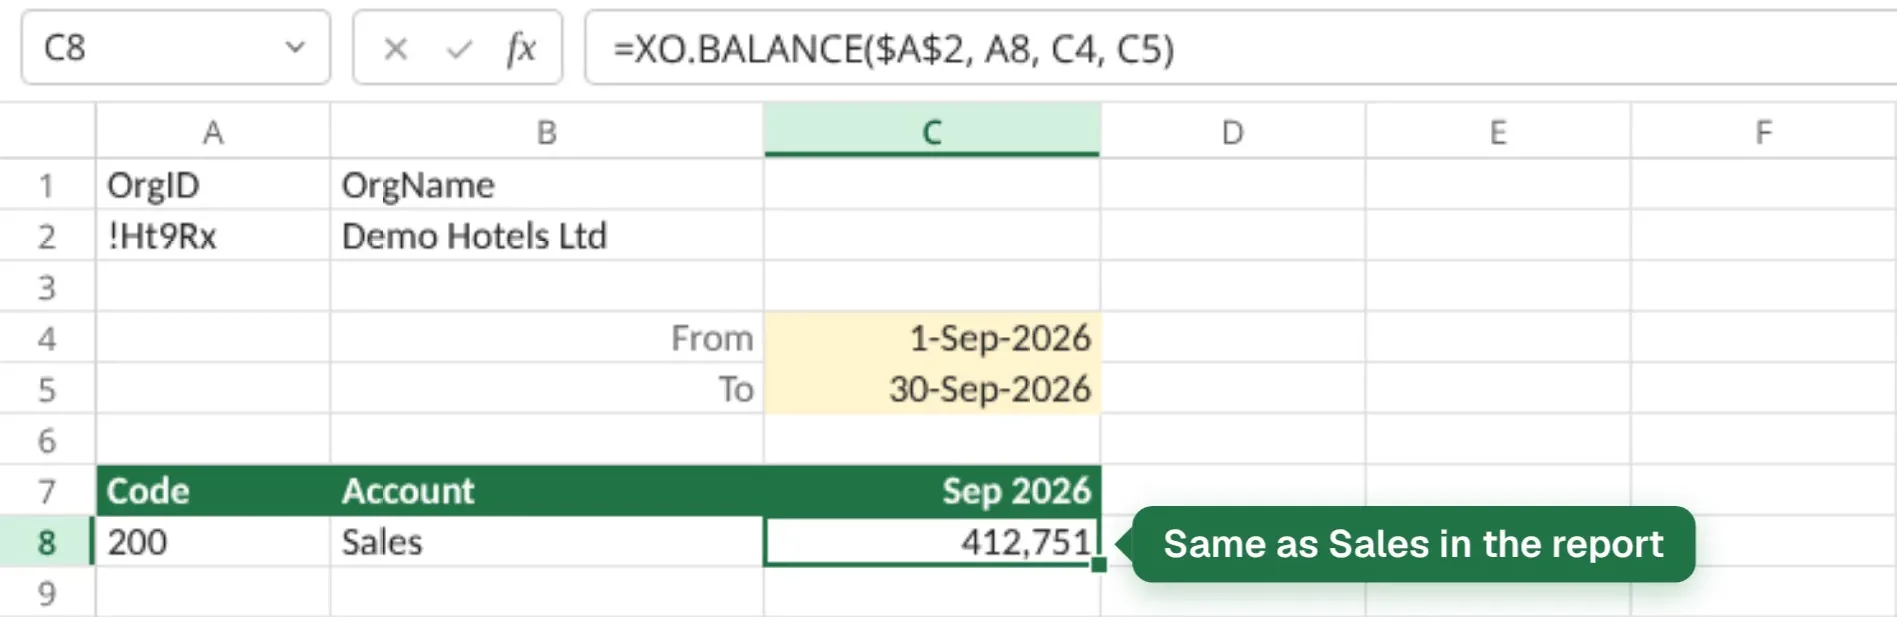
Reports as live tables in Excel and Google Sheets, formulas in any Excel cell, one company or many. Refresh when Xero changes.
Why choose XO Report
- Formulas like XO.BALANCE in any cell; click Refresh in the task pane for the latest Xero figures
- From $9.90/mo for one organization
- Exact balances on any date, for a 4-4-5 or weekly close (accounts without a tracking filter)
- Monthly comparisons include every day, so the 31st is never dropped
- Works in Google Sheets too, on the same plan
Pricing: Flex uses AUD connection pricing: AU$60/mo includes up to 10 connections, with prices ex GST and local currency/taxes applied at checkout. XO Report starts at $9.90/mo for one organization.
Price comparison
Monthly list prices as published, before tax. Check each vendor's page for today's terms.
| Orgs | XO Report | Flex Financial Reporting | Pricing note |
|---|---|---|---|
| 1 | $9.90 | AU$60 | Lower XO entry price; FX/tax varies |
| 3 | $14.90 | AU$60 | Lower XO entry price; FX/tax varies |
| 10 | $29.90 | AU$60 | Different currencies |
| 50 | $99.90 | AU$300 | Different currencies |
See XO Report
at work.
Pictures of XO Report with demo company data. Each one opens a guide.
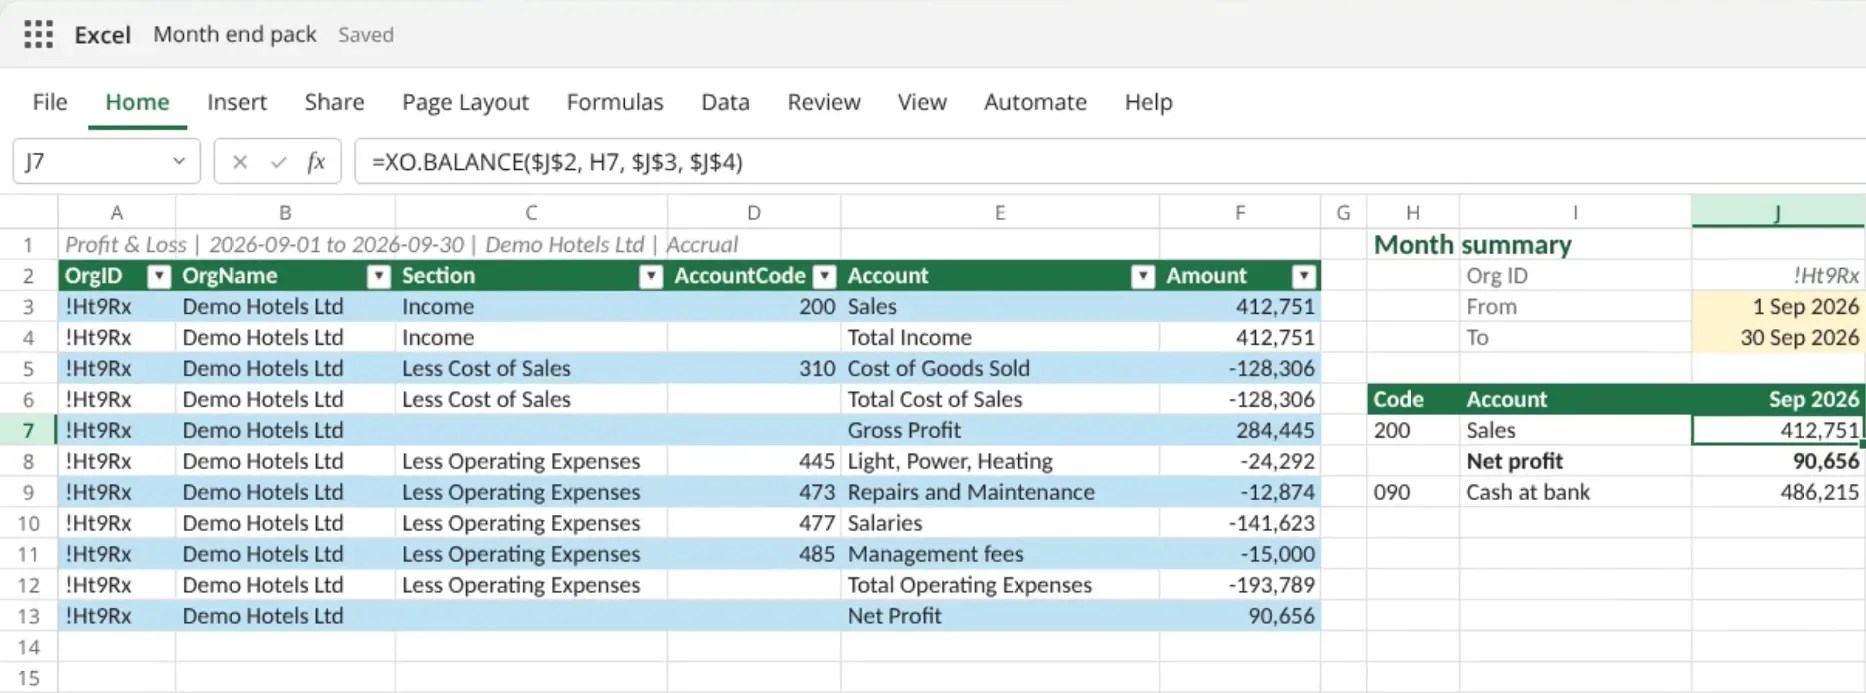
 Reports as live tablesA Profit & Loss straight from Xero, as a table you can filter, pivot and refresh.
 Several companies, one workbookOne company or many: in Excel, put each company in its own column with XO formulas and refresh them together.
 Formulas for your own layoutsXO.BALANCE and the other XO formulas, in any cell of your own sheet. Excel only.
 In Google Sheets tooThe same tables and reports from a sidebar, on the same plan.
Frequently asked questions
Is Flex Financial Reporting an Excel add-in?
Yes, Flex Financial Reporting works within Excel. It's one of the most-reviewed Excel apps on the Xero App Store and offers data tables, including Xero's reports as tables.
Does Flex have custom Excel formulas like XO Report?
No. Flex does not offer custom Excel formulas like =XO.BALANCE. XO Report gives you both Excel-native formulas and built-in report workflows, so you can use formulas for custom models and reports for standard outputs.
Which is better for multi-org reporting?
Both can report across several Xero organizations. Flex's Combine Tool merges similar tables from different organizations into one table, with a column showing where each row came from. In XO Report you can pick several organizations when you insert most tables and reports, and it combines them into one table with organization name columns; formulas such as =XO.BALANCE read one organization each, so you can add them together across organizations. The bigger differences are formulas (XO Report has them, Flex works from data tables) and price: XO Report is $9.90/mo for one organization, while Flex is AU$60/mo for up to 10 connections.
How does Flex Financial Reporting pricing work?
Flex uses a connection model: AU$60/mo includes up to 10 Xero organization connections, then graduated AUD pricing applies for additional connections. Prices are ex GST, and local currency conversion and taxes can vary at checkout.
Can I get a balance sheet figure for a non-month-end date?
In XO Report, yes: =XO.BALANCE returns the exact balance on any date in one cell, for example on a 4-4-5 or weekly close calendar. Accounts with a tracking filter still need a month-end date, because Xero only reports those at month-end.
Does Flex have the month-end comparison issue with the 31st?
A December 2025 Xero App Store review of Flex notes that monthly-comparison P&L tables can leave out transactions dated on the 31st, a known Xero quirk. XO Report works around this automatically, so every month in a comparison includes all of its days.
Try XO Report free
Add it to Excel or Google Sheets, connect Xero, and compare for yourself. 14-day free trial, no credit card required.
Free trial · No credit card · Cancel anytime